|
|
Seismic Wave Theory
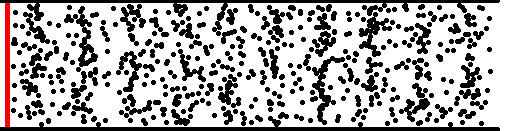 Compressional Waves, which are also called P waves, are basically the same as sound (acoustic) waves, except that P waves move through solid or liquid media (e.g., the ground or a pond), as opposed to the air. Thus, P waves represent zones of contraction and expansion. The view at right shows what P waves would like if we were looking down at sand grains on the surface of a sandstone bed. The two-way wave travel times of P waves are the data that make up the 3D seismic surveys and 2D seismic lines that are usually used in petroleum exploration today.
|
| |
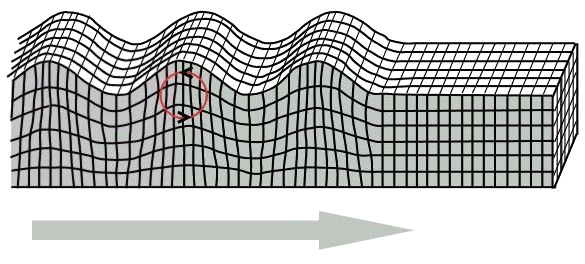
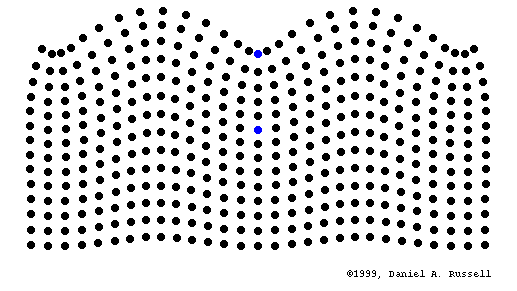
Rayleigh Surface Waves are the surface expression of P waves. When the zones of compression and expansion that make up P waves are examined in the cross-section view of a surface, they become up and down motions that propagate across the surface - the same as ripples in a pond. Ocean waves and pond ripples are basically Rayleigh waves in a liquid medium. Note how in the cross-sectional animation at right and in the static image below, the individual sand grains move in circular motions - again the same as water molecules in an ocean wave. Basically, Rayleigh waves are ripples that travel across the surface of the earth in response to earthquakes, explosians, vibroseis trucks, and other P wave sources. Also, the up and down motions of Rayleigh waves are the data that are actually recorded by geophones during seismic data acquisition.
|
Rayleigh Surface Waves in cross-section |
| |
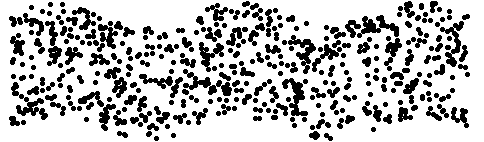 Shear Waves, which are also called S waves, represent the back and forth motions of grains in a solid media. Thus, shear waves propagate through solids only, and cannot travel through gas or liquids. Although P waves are the primary form of seismic data utilized by geophysicists, S wave data are routinely recorded these days as well (i,e., as the the back and forth motions of the geophones), which is fortunate as S wave data can give important information on fractured reservoirs, among other things. Note how in the S wave animation above the sand grain motions take place in a single plane, and not in circular motions as with P waves. Note also the absence of zones of compression and expansion propagating through the media.
|
| |
|
Seismic Wave Propagation can get rather complex. When P waves originating from a point source, such as an explosion or a vibroseis truck, travel into the ground, they are reflected back from bedding surfaces as a function of the impedence of the beds, which is a measure of the density of the rock times the velocity of the wave (acoustic velocity). The impedence contrast (difference) between the beds above and below the surface determines how much of a wave is reflected back, and how much wave energy passes though the bed. The greater the impedence contrast, the greater the strength of the reflected wave. As P waves propagate and reflect back to the surface, they interfere with each other, which creates noise and dimenishes signal strength. Diffraction takes place as well, which is where some of the energy that travels through the bedding surface changes its direction of travel. It all gets quite complicated as the animation above shows. This is why seismic data processing these days is so computer intensive. Clearly it would be nearly impossible to process seismic data from a geologically complex area today without the aid of computers.
|
|
|